The problem with standard GA reports is that they are not always suitable to our goals. All businesses and websites are unique and have different needs.
Thankfully, GA allows users to create custom reports and dashboards that provide instant access to the data you need.
We’ve scoured the web and collected a list of 14 Professional Google Analytics Custom Reports That Will Boost Your Data, with their descriptions and tips how to use them.
What are Google Analytics Custom Reports?
I asked my colleague in marketing whether he knows what Google Analytics Custom Reports are.
His eyes widened in shock, like a deer staring into the headlights of the oncoming truck.
Google Analytics Custom Reports are selected threads of data that are mined from the already available pool of your website. Instead of scuttling through various tabs, segments and other elements of the interface, you can pull up all data relevant to your strategy with one click.
I’ve got tired once with searching for all possible social media traffic through the Acquisition -> All Traffic paths. The difference between the domain m.facebook.com and l.facebook.com is one letter, but it’s aggregated separately. That can be frustrating to count if the disparity in traffic between the two is too big – you must know what you are searching for.
Google Analytics Custom Reports allow you to put separate threads like that together. This provides you with a precise overview of, say, social media traffic. Of course, this can be applied to many other areas for even more powerful reporting.
You can create reports yourself, but that is advised only when you know what you need in a report. The problem is, with Google Analytics we do not know that we need a given metric unless we see it first (or we read about it in an article somewhere).
There are professionals who solved that problem for us – there are various Google Analytics Custom Reports available on the internet that solve common pain-points and improve our work. They can be imported with one click without messing up your data – even more reasons to use them.
Available Google Analytics Custom Reports List
Occam’s Razor Awesomeness – link to the report
Created by Avinash Kaushik, a star web analysts, Occam’s Razor is your weapon of choice when fighting with data.
It is a Swiss knife of 6 custom advanced segments, 9 custom reports and one dashboard.

- Oligarchs is a segment of users that are filtered by the rule “Revenue per session is larger than 20000.” Of course, in most cases such numbers are even unthinkable of, but you can leverage this segment and adjust it to your needs. Oligarchs are users that are most profitable for your business, especially an ecommerce store. Adjust the number to the average you experience – Go to the Admin panel, and choose “Segments” in the Personal Tools & Assets category. There, choose AK: “Oligarchs,” go to “Conditions” and change your number.

- Loyal Visitors are what they are – the loyal frequenters of your website. Useful for anyone running a website with recurrent content, blogs, newsletters and such. They are filtered through the count of sessions – by default it is larger than three. Good in determining whether your content strategy is actually bringing long-term users (who will move down your conversion funnel).
- Visits via search queries w/ 4 words is a method to segment and report long tail key phrases instead of keywords. It’s an expression that can be modified even up to 10 words – just change the number in the brackets. Great for analyzing how long your search tail is and figuring out the amount of words you should bid (and you should know by now that long tails are a way to go!)
- Blog Comments Submitters counts people commenting on your website. However, it will not aggregate data from services such as Disqs.
- Non-flirts, potential lovers is a unique way of discerning the difference between bouncing “flirts” and potentially interested visitors. It analyzes the page depth (by default larger or equal to 3) of a user and provides you with info how many people are ready to overcome the initial stages in your funnel. If the number is incredibly low, it means your CTAs and other steps in the funnel need immediate work.
- All Social Media Visits is self-explanatory – a segment aggregating social media visits. However, it is advised to expand the conditions with other sources: lnkd.in, t.co and such are other variants of popular networks that are not listed in the segment.
- Visitor Acquisition Efficiency Analysis Report reviews the efficiency and performance of all sources of traffic to the site, such as PPC, SEO, etc. It displays all traffic sources, aggregates all input metrics and chosen behaviors, measures business value that was added and calculates the cost of traffic acquisition.
- Content Efficiency Report helps identify the pages that are performing the best, and which do not. Perfect for websites that are producing content – especially blogs.
- Landing Pages Report is also self-explanatory. Having bad landing pages leads to wasted money and this report displays the Entrances/Pageviews, the Bounce Rate and the Page Value to tell you which LPs need improvement.
- Hostnames displays all domains where your Google Analytics tracking code was fired. It’s useful for determining whether users are using your websites from multiple domains that are storing different cookies – this might corrupt your data, so be wary.
- All Traffic Sources ABO measures the performance of the traffic sources in the following 3 areas: Acquisition, Behavior, and Outcomes. According to Kaushik, it is important to look at all of these to determine how beneficial particular traffic sources are.
- E2E Paid Search Reports is useful for combining site performance with AdWords data. This will help you discover which campaigns do work, and which need optimization.
- Internal Search Site Analysis is very useful for determining keywords that are interesting for your website visitors. Great for figuring out keywords that can be used in your future content.
- Mobile Performance Analysis helps you determine how mobile traffic is valuable for your business. Since mobile is currently a strong contender in the digital marketing industry, it is important to track data coming from such devices. You can learn more about this report at Kaushik’s website.
Business Outcomes Analysis Report – link to the report
Another handy addition by Kaushik, BOA makes use of the Enhanced Ecommerce feature by Google Analytics and helps you understand business outcomes coming from gathered data.

By Avinash Kaushik
Buy-to-Detail measures the amount of products purchased per number of product-detail views. Useful for determining whether the content of your details is helpful in increasing your conversion rates. The other metrics are already common, but if you need more explanation, head to the post by Kaushik that explains the report in detail.
Browser Report – link to the report
An analysis of the performance of browsers on your websites. If certain browsers display high bounce rates, it might mean that there are browser-specific bugs that are turning visitors away. This requires immediate attention.

Site Diagnostics: Page Timing – link to the report
Great report by Rachelle Maisner that reveals all problematic pages, which need improvement. I use it on our blog to determine whether there are any images that are not in a proper format and cause huge loading times.
By setting the view to “comparison”, you can compare the bounce rates and the time taken to load the page.

Referring Sites Report – link to the report
A creation by Anna Lewis, this report shows which referring sites are most valuable and which contribute to goal conversions.

By eConsultancy
Hours & Days Report – link to the report
Designed by Dan Barker, it shows which days of the week and times of the day are best for your traffic. Extremely useful for your content marketing.
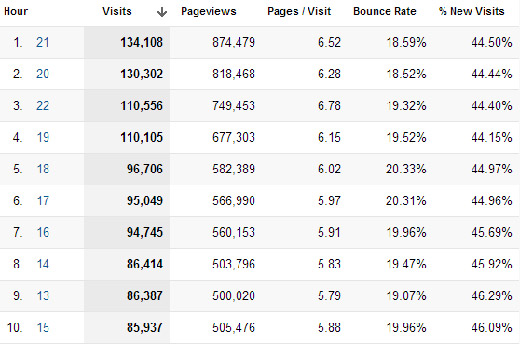
By Kissmetrics Dan Barker
Should You Use Google Analytics Custom Reports?
Definitely. The reports allow you to aggregate data in a very time-efficient way, and some unveil data that you would otherwise be unaware of. Installing them requires just one click and a lot of time – but be sure, that time will be very well spent.
Head to our comments section to discuss the reports – maybe you’ve created one yourself or are using a report that would make a great addition to this list. Share your opinion with us!
PS. Google Analytics only shows you that something happens, UsabilityTools shows you where. You can watch on recordings how people interact with your content on websites and webapps, and quickly spot errors that make your product unusable.
It’s free for 14 days: UsabilityTools Session Recording.
The post 14 Professional Google Analytics Custom Reports That Will Boost Your Data appeared first on UsabilityTools.com Blog.


